

Case study
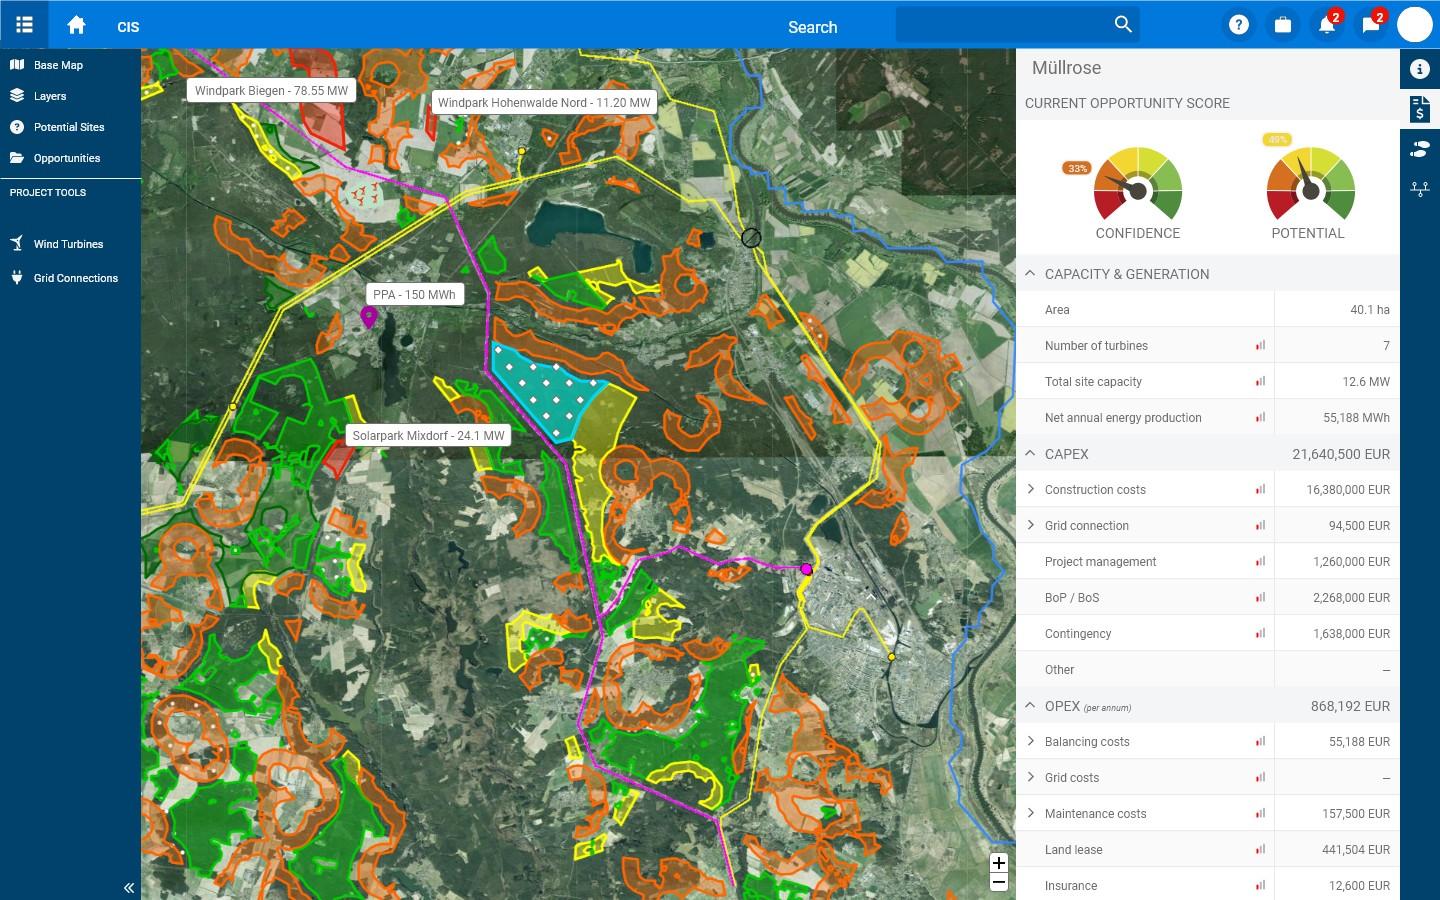
Possible wind farm sites, scored from 0 to 100.
How a proof of concept for a major European energy company brought land, wind, layout, grid and money into one score, to find the most promising sites faster.
- Client
- The renewables division of a major European energy company
- What we built
- A working proof of concept that scores possible wind farm sites
- How it was delivered
- In about three months, with short feedback loops with the client's team
The challenge.
The division finds and develops new sites for wind and solar farms. Competition for good sites was growing, particularly in Germany, and assessing each one was slow, manual and inconsistent.
The work ran through separate tools. A mapping tool ruled out unsuitable land, layouts were tested by hand, and a spreadsheet model checked whether a site would pay. Some early scripts existed, but nothing was joined up, and the inputs were general figures rather than detailed simulations.
The client wanted two things from a proof of concept. Something working to show the business, to justify a larger investment. And a view on the best way to build a full system, including whether it should stand alone or sit inside the mapping system they already had.
What we built.
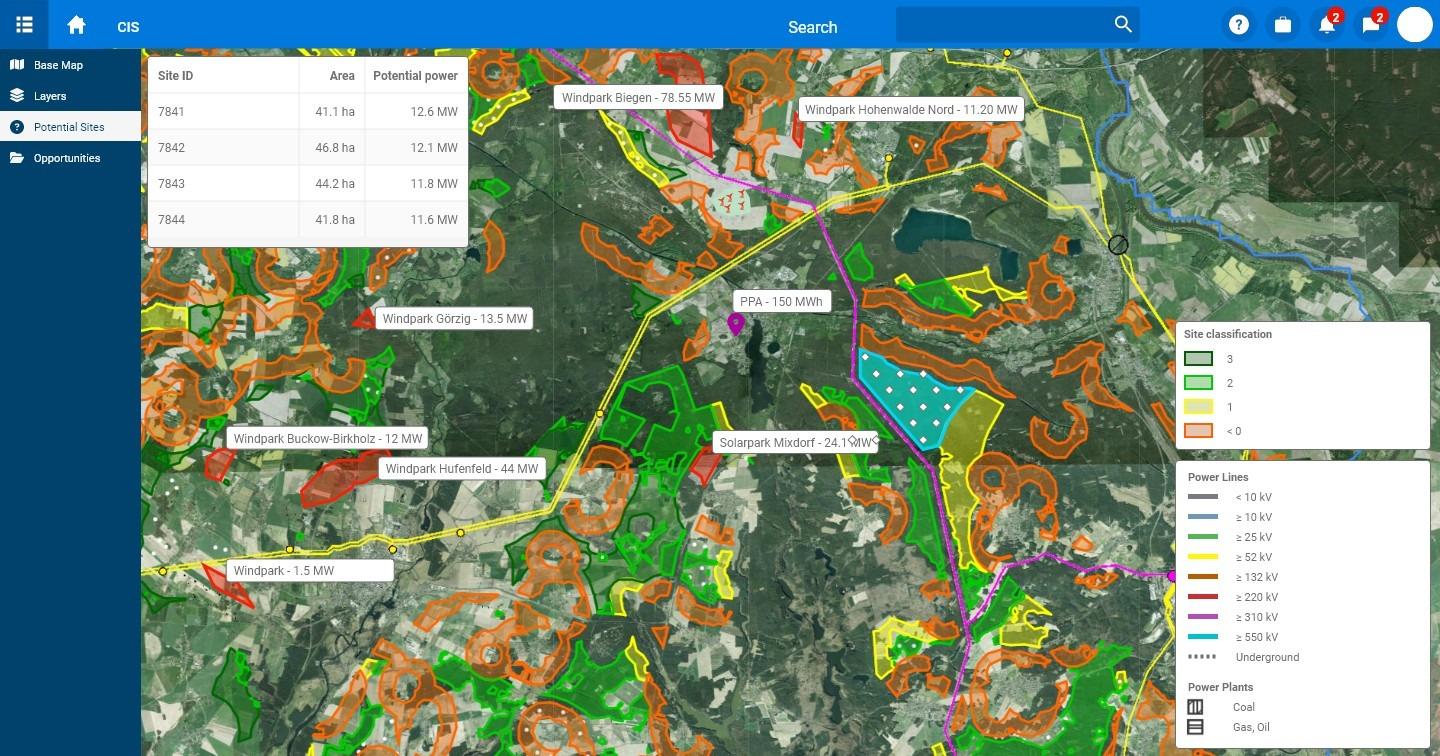
One application that takes each site through every check in turn:
Land.
Find the land that could take turbines.
Turbines.
Choose the best turbine model for the site.
Layout.
Simulate possible turbine layouts for the site.
Grid.
Check whether the site can connect to the electricity grid.
Money.
Run it all through the client's own financial model, to give one score from 0 to 100.
The scores turn into a ranked list of the most promising sites.
The hard parts.
- A spreadsheet that became software. The client's financial model lived in a spreadsheet. We rebuilt it in code, so every site is judged by the same calculation.
- Joining tools that were never meant to meet. Public map data, historical wind data to simulate conditions on site, the client's own layout scripts and its financial model all had to work as one.
- Keeping the data in-house. The client was wary of putting its own data on a cloud platform. We tried several mapping platforms, and recommended running one inside the client's own data centre.
The result.
- 0 to 100
- one score for each possible site
- About 3 months
- to a working proof of concept
The proof of concept changed how the client approaches the first look at a site. The same logic could be extended to score hundreds of sites automatically in the background, cutting the manual work and leaving people to focus on the most promising sites. The client followed our recommendation, began setting up the mapping platform in its own data centre, and is looking at turning the proof of concept into a full system. Land ownership data, and road access for delivering turbines, were identified as useful next steps.
For the technical reader
| Layer | Technology |
|---|---|
| Map data | OpenMap data for base layers and boundaries |
| Wind data | WindAtlas historical data |
| Financial model | The client's Excel model, rebuilt in JavaScript |
| Layouts | The client's Python module, generating layouts from GIS inputs |
| Mapping | ArcGIS components and Mapbox evaluated; ArcGIS Enterprise recommended |
Data sovereignty concerns about uploading proprietary datasets to Azure-based infrastructure counted against ArcGIS Online. ArcGIS Enterprise, run in the client's own data centre, keeps the data in-house and allows deep integration with the client's systems. Delivery used Kanban with fast stakeholder feedback.
Not sure which way in?
A first conversation costs nothing. We'll tell you where we'd start, and if the answer is not yet, we'll say so.
Or email info@khiliad.com, or .